Nowcast 2.0: Accessible IMD Doppler Radar Analysis for everyone
On of the many things that I've found myself subconsciously indulge in nowadays is to check up on the X feeds of several 'weather bloggers'. The attraction is that these bloggers are able to somehow provide high-frequency updates around real-time weather conditions, often localised for different Indian cities. More often than not, they turn out correct- and given that they are more expressive in their communication, find a spot with the masses. Over time, I realized that all of them rely on a core meteorological instrument called the 'Doppler Radar' from the Indian Meteorological Department (IMD) for their commentaries. It struck me then - can we look to automate the insights that these bloggers provide - in the form of short-sized bytes, but across multiple cities & languages?
Integration Overview
Given that the system has to deal with user inputs, radar report extraction, and subsequent analysis, I charted a quick application flow for subsequent building. It's a fairly simple tech stack: Streamlit does the UI, while GPT-5-mini (latest-generation, cost-effective GPT text/visual model) renders the analysis.
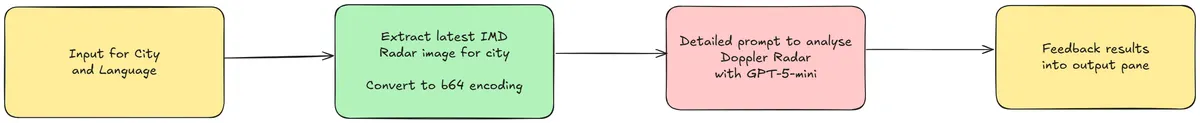
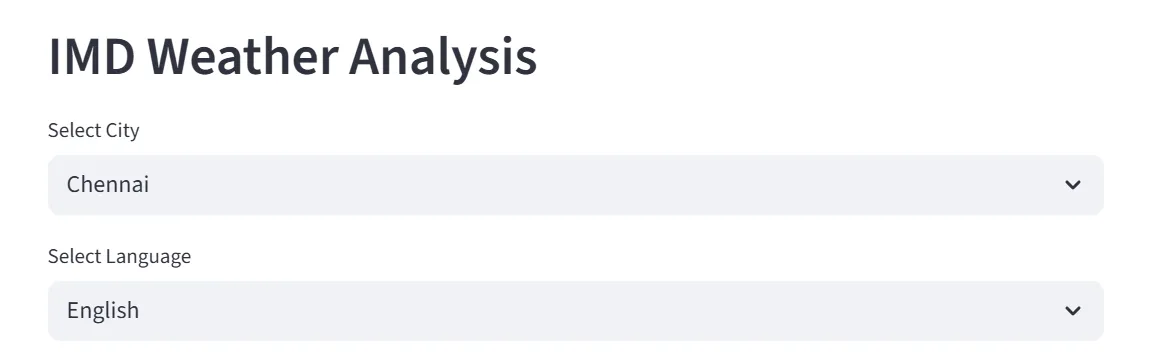
The user inputs are collected at the start, precisely the city to be tracked and a preferred user language. Based on my own experience, I've seen very high demand for accessible weather reporting in local Indian languages, for the masses who are not proficient in English. Therefore, the analysis should be rendered in the language of choice for the consumer. We use the Streamlit selectbox() module for the inputs, as drop-downs.
Data Collection - Extracting the Radar Visual
The Doppler Radar reports are uploaded periodically to the IMD's portal, at a frequency of every thirty minutes. As a Central organization, the IMD has established radars across India. For purposes of this application, we will choose the four metropolitan cities - Delhi, Mumbai, Chennai & Kolkata. On closer inspection, it was found that the radar reports are uploaded to unique URIs for each of these cities, as GIF files. It was now a matter of mapping the city to the URI code to obtain and extract the Radar Report.
city = st.selectbox("Select City", ["Chennai", "Kolkata", "Mumbai", "Delhi"], index=0)
city_code_map = {
    "chennai": "cni",
    "kolkata": "kol",
    "mumbai": "vrv",
    "delhi": "delhi"
}

DEFAULT_IMG_URL = f"https://mausam.imd.gov.in/Radar/caz_{city_code_map[city.lower()]}.gif"

st.image(DEFAULT_IMG_URL)
Referenced below is a sample Doppler Radar observation for Chennai:
Radar to Report: Inference of Doppler Radar observations
We now have to design the core application functionality: making sense of the technical Doppler Weather Radar (DWR) visual that we were able to extract in the previous stage. Typically, these reports contain the maximum reflectivity - MAX(Z) score for the radar base station. Coverage decreases with increasing distance from the center of the station.
Reflectivity (Z) is an estimate of how much energy is reflected back to the radar by precipitation particles in the atmosphere, such as rain/hail/snow, etc. Given that reflectivity depends on factors like the droplet size (it is proportional to the sixth-power of diameter!) and the number of particles, in general one would assume that higher the Z, higher the rainfall. In actuality, the relation is defined as below, where a and b are empirical constants, and R is the rainfall volume.
Given the value of Z can stretch into high orders of magnitude, conventionally the logarithmic scale is used to measure it. This is why the observations are logged as dBZ and not Z.
So - back to our application - we need to build an effective prompt that allows us to infer the DWR image using a GPT Vision model. This is our prompt function. I've asked the model to throw in a bit of emojis where relevant to make it engaging - weather analysis can otherwise be very boring :)
def build_prompt_imd(language: str = "English", city: str = "Chennai") -> str:
    return (
        "You are a meteorology expert analyzing an Indian Meteorological Department (IMD) Doppler radar image for Chennai. "
        "Focus ONLY on the innermost concentric circle around the base station at the exact center. "
        "Use radar dBZ conventions (e.g., <20 light, 20–40 light–moderate, 40–55 moderate–heavy, >55 severe convection) to infer near‑term rainfall intensity at that center point. "
        "Then, in a summary of 1–2 short paragraphs, explain (a) what to expect now at the center and (b) what is likely over the next 30 minutes based on the structure and apparent motion of surrounding outer bands relative to the center rings. "
        f"Extract the radar timestamp shown on the RIGHT‑HAND section of the image ({"UTC, convert to IST" if city == "Chennai" else "Indian Standard Time, IST"}) and include it explicitly in the observation. If illegible or missing, state 'Timestamp: unknown'. "
        "Be concise, expert, and specific to the innermost circle; use the outer bands only to justify the next‑30‑minute expectation. Make it layman friendly, but use the standard weather reporting convention terms where necessary."
        f"Provide the analysis in the language of the user: {language}."
        "Use appropriate emojis to make the analysis more engaging."
    )
Now that our prompt is ready - we need to actually pass the DWR image to the model of choice. But before we can pass an image to the OpenAI model, we need to obtain the base-64 encoding of the image, which will subsequently be passed to the API.
def get_base64_image() -> str:
    # Get image using requests
    response = requests.get(DEFAULT_IMG_URL)
    return base64.b64encode(response.content).decode("utf-8")

def call_gpt_vision(language: str = "English", city: str = "Chennai") -> str:
    client = OpenAI()
    prompt = build_prompt_imd(language, city)
    b64_image = get_base64_image()
    try:
        response = client.chat.completions.create(
            model="gpt-5-mini",
            messages=[{"role": "user", "content": [{"type": "text", "text": prompt}, {"type": "image_url", "image_url": {"url": f"data:image/png;base64,{b64_image}"}}]}]
        )
        return response.choices[0].message.content.strip()
    except Exception as e:
        return "There was an error parsing the image."
Voila - our application is now ready to be consumed!
Deployment, Results and Consumption
Given that the application is built with Streamlit, I've chosen to host the solution on the Streamlit Cloud. A solid advantage of the platform is that deployments are incremental with automatic CI/CD linked to the codebase from the Git repository.
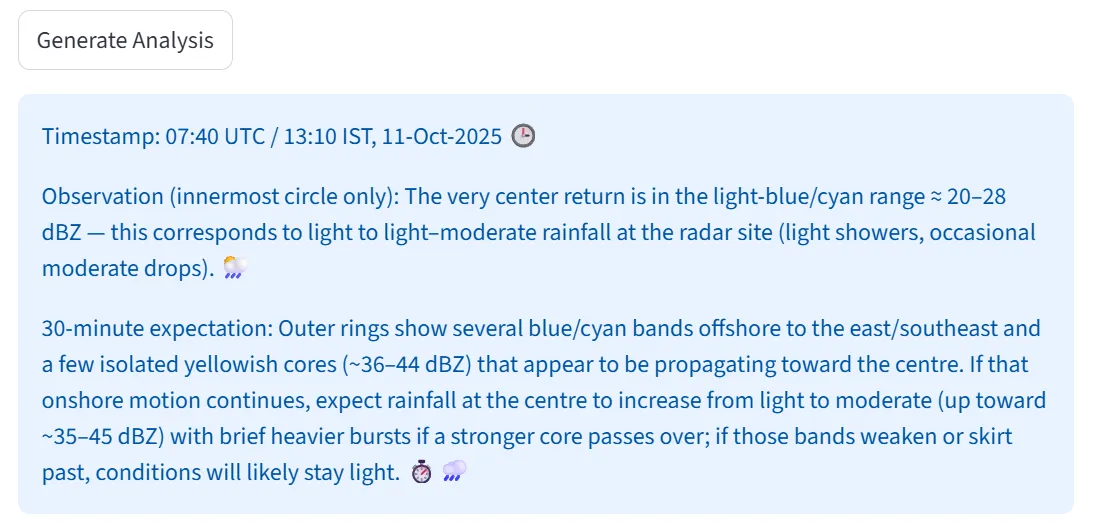
To trigger the analysis, one needs to hit the 'Generate Analysis' button below the latest DWR visual. The system does a back-and-forth with the LLM APIs in the background, and returns with the inferred outputs. The corresponding result is wrapped in a Streamlit information box:
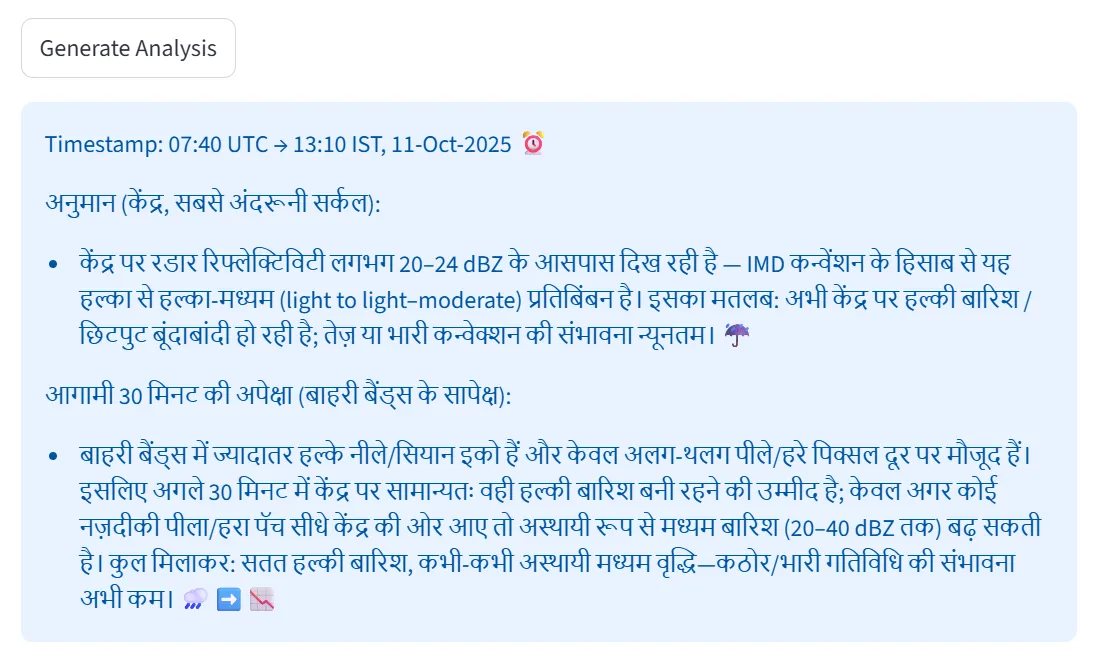
As previously described - the multilingual capability of the backend model can also be leveraged to make the analysis more accessible - here is one example of the same report, but in Hindi:
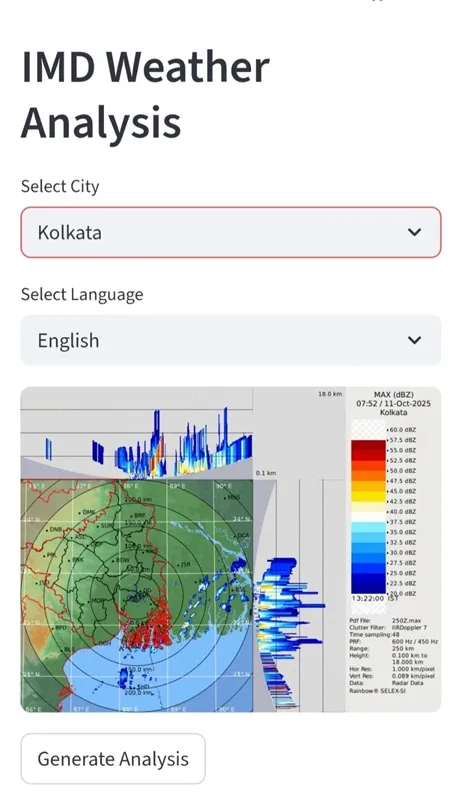
The nature of the application makes it incredibly helpful to be mobile-first. This is where the Progressive Web Application (PWA) concept kicks in - Streamlit offers the ability to be installed as a 'lite app' on the mobile phone, essentially being nothing but a rendering of the website through the mobile OS's native browser. I installed the lite app on my phone, and this is how it looks - very neat and convenient!
As a disclaimer - of course, AI generated inference may not always be correct. Therefore, please also consult official IMD reports and local government authority alerts beside the usage of the tool. I had a lot of fun building the prototype. I've open sourced the code, and is publicly available on my GitHub repository.
You can try out the application here: IMD Radar AI